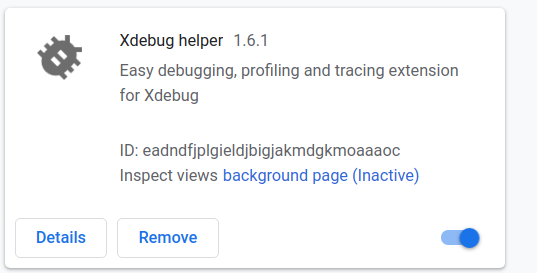
phpstorm+phpstudy搭建xdebug审计调试环境 2018-08-05 07:33:23 Steven Xeldax ## PhpStudy配置 找到自己所习惯使用的php版本,此处选择使用php5.6,将phpstudy切换版本。 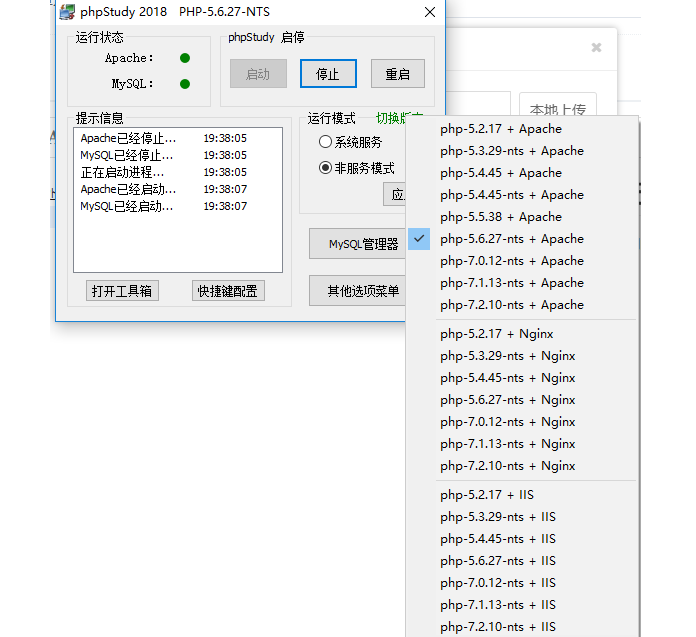 打开php5.6的php ini文件,增加xdebug的相关配置。 ``` [XDebug] xdebug.profiler_append=0 xdebug.profiler_enable=1 xdebug.profiler_enable_trigger=0 xdebug.profiler_output_dir="D:/software/phpstudy/PHPTutorial/tmp/xdebug" xdebug.trace_output_dir="D:/software/phpstudy/PHPTutorial/tmp/xdebug" zend_extension="D:/software/phpstudy/PHPTutorial/php/php-5.6.27-nts/ext/php_xdebug.dll" ;remote xdebug.remote_enable=1 xdebug.remote_handler = "dbgp" xdebug.remote_host = "127.0.0.1" xdebug.remote_port = 9000 xdebug.idekey = phpstorm-xdebug ``` 修改配置后:  在选单中打开xdebug,配置好后重启服务器看phpinfo中是否有xdebug的信息。 ## PhpStorm配置 1. php解释器的配置,其实这一步和xdebug并没有太大的关系。 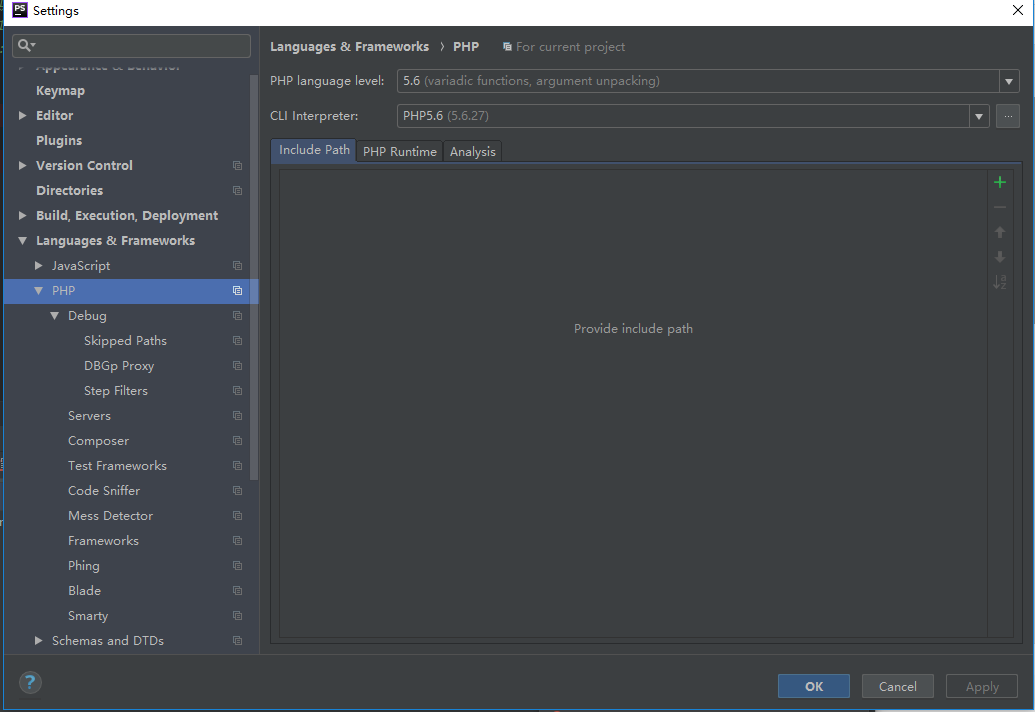 2. debug port要与phpini中配置要一样。 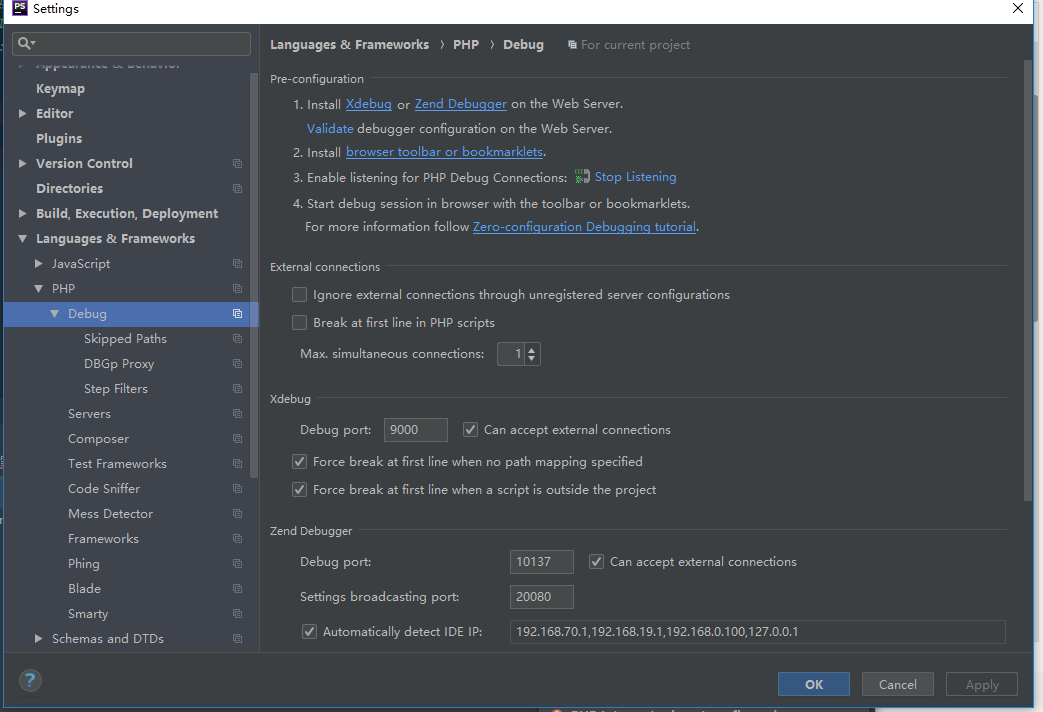 3. 配置端口地址,其外设置IDE key 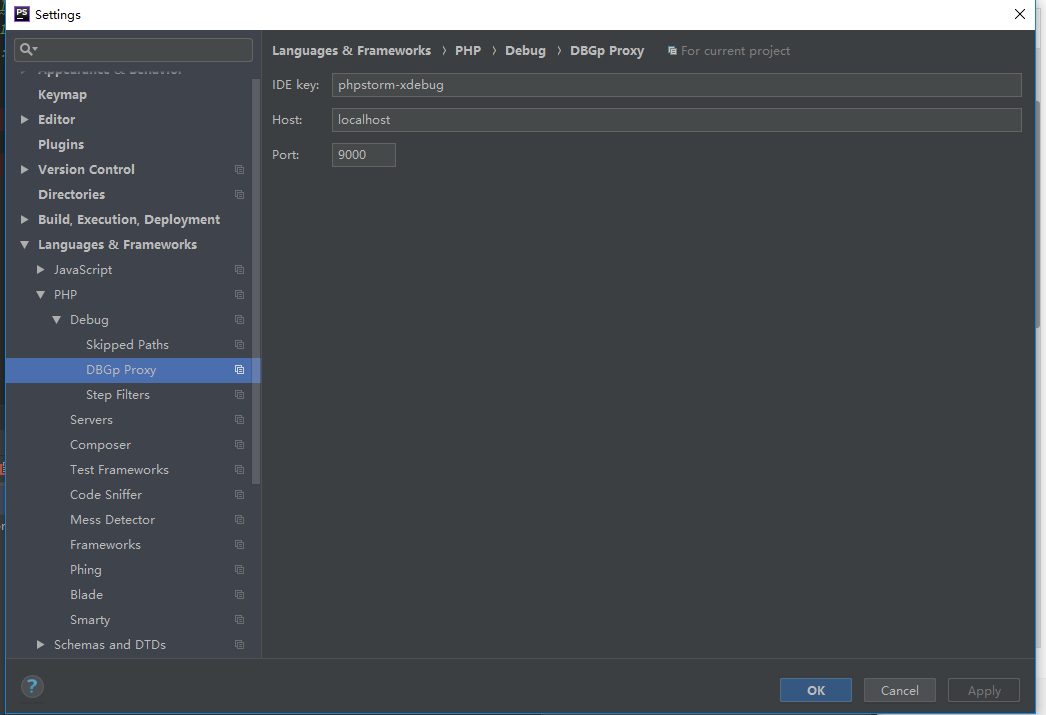 4. 设置web服务器。  5. 选中edit configuration 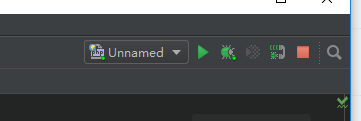 6. 设置php web page的配置  ## chrome 配置 !!! 注意一定要安装xdebug helper的扩展插件,不然phpstrom是监听不到请求的。 https://github.com/wrep/xdebug-helper-for-chrome